Research Project
3.2 Report writing guidelines 2022
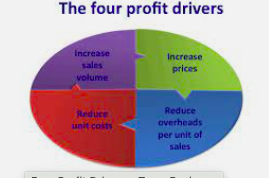
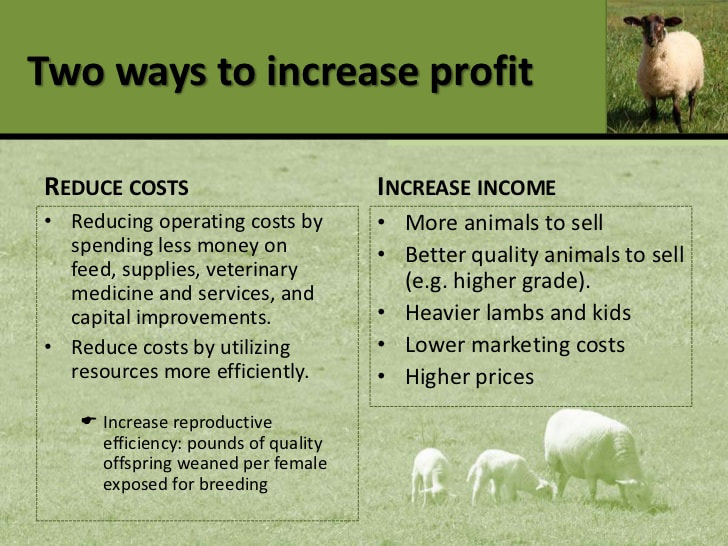
PROFIT = INCOME (AVERAGE PRICE X QUANTITY SOLD) – COSTS.
Section A. Factors that impact the profitability of your chosen product
For your chosen product:
Select (find) and process (summarise, include graphs and tables) information related to specific factors that have impacted:
Consider:
Section B. Impacts on the Production Process
Explain the impact of the factors mentioned in section A on the production (on farm) of ‘the chosen product’
E.g. What do producers do make sure they receive the highest price the can, how can they maximise the quantity they produce/sell and how they can minimise cost while not impacting prices or quantity.
Section C. Critical Analysis
Select which of the factors have the greatest effect of the profitability when producing your product. Justify your selection.
i.e. Consider “PROFIT = INCOME (AVERAGE PRICE X QUANTITY SOLD) – COSTS.” again. From your studies, what are the key things that determine the profitability of your product (you are probably only looking at 3 or 4 across all 3 areas – price received, quantity produced and costs involved.
You must include referencing of your key data, etc
Share your folders with me and prompt me when you want feedback.
PROFIT = INCOME (AVERAGE PRICE X QUANTITY SOLD) – COSTS.
Section A. Factors that impact the profitability of your chosen product
For your chosen product:
- Graph the prices producers have received over the past 3 years
- Graph the quantity NZ producers have produced over the past 3 years
Select (find) and process (summarise, include graphs and tables) information related to specific factors that have impacted:
- the prices that have been received*
- the quantity produced
- the cost involved in producing/selling the product.
Consider:
- Physical and climatic conditions (topography, weather patterns, droughts, frosts, wind events, etc)
- Social (availability of labour)
- Technological (scanning ewes, irrigation, breeding, alternative feeds or management)
- Economic (Exchange rate changes, interest rates)
- Political e.g free trade agreements, tariffs, quotas,
Section B. Impacts on the Production Process
Explain the impact of the factors mentioned in section A on the production (on farm) of ‘the chosen product’
E.g. What do producers do make sure they receive the highest price the can, how can they maximise the quantity they produce/sell and how they can minimise cost while not impacting prices or quantity.
Section C. Critical Analysis
Select which of the factors have the greatest effect of the profitability when producing your product. Justify your selection.
i.e. Consider “PROFIT = INCOME (AVERAGE PRICE X QUANTITY SOLD) – COSTS.” again. From your studies, what are the key things that determine the profitability of your product (you are probably only looking at 3 or 4 across all 3 areas – price received, quantity produced and costs involved.
You must include referencing of your key data, etc
Share your folders with me and prompt me when you want feedback.
Referencing - This is really, really important
|
|
|
What is Profitability
|
Profitability is the ability to make a profit for the producer. Profitability may be determined by on-farm practices, off-farm processes, & other factors.
|
|
|
Factors

|

|

|

| ||||||
he effects of a range of farm management strategies on the characteristics of the wool produced by Merino sheep in southern Australia were investigated. The physical and financial responses induced by the different strategies were examined under a variety of seasonal and market conditions using a model of a self-replacing flock of Merino ewes. Historical climatic and financial data collected in Hamilton, western Victoria, were used to determine the conditions experienced over a period of 23 consecutive years. An existing model of a sheep flock was extended to provide the detailed predictions of fibre diameter, staple length and staple strength required to assess the strategies under test. Fibre diameter and staple length were predicted as a function of wool growth rate, with the variation in cross-sectional area along the length of the fibre used to predict staple strength. An analysis of historical records of variation in the level of vegetable matter contamination of wool sold in Victoria was used to relate the level of contamination to both the time the sheep were shorn and the fibre diameter. The accuracy of the model in predicting the characteristics of the wool produced under a wide range of conditions was assessed by comparing the predictions with an extensive set of field data. The model successfully mimicked the pattern of pasture and sheep liveweight change over three consecutive years and for a wide range of stocking rates. There was no evidence of bias in the predictions of fleece weight or the characteristics of the wool produced so that, in general, the assessment of the performance of the model was very favourable. In a preliminary analysis, the importance of individual wool characteristics as determinants of the price of Merino wool was assessed, these being fibre diameter, staple length, staple strength and vegetable matter level. Two methods of determining the value of each characteristic were employed. The first method used present day values of the wool characteristics and the second used procedures developed recently for predicting the processing performance of the wool as a means of forecasting its future value. Fibre diameter was identified as the most important determinant of the price of Merino wool, regardless of which of these methods was used. Furthermore, the effects of management changes on fibre diameter were found to have the opposite effect on price to the effect of changes in staple length and staple strength. The effects of a range of management strategies on the physical and financial responses of flocks composed of Peppin or South Australian Merino ewes were assessed in a series of four simulated experiments. Of the strategies tested, changing from the traditional practice of lambing in autumn to a winter lambing time produced the best overall improvement in fleece characteristics. Not only was the wool produced by ewes lambing in June/July of higher price than those lambing in May, their higher reproduction rate and lower supplementary feed requirements, together with the improved financial returns from wool, increased the net cash income by more than 17%. Ewes lambing in May often had little or no green pasture available in late pregnancy and their wool growth rate, staple length and staple strength were depressed during autumn, particularly in years when there was a late start to the pasture growing season. Increasing the quantity of supplementary feed provided during periods when there was insufficient pasture available to meet animal requirements, increased fleece weight, staple length and staple strength. However fibre diameter was also increased, this having a negative impact on the value of the wool such that there was no net effect of the changes in wool characteristics on price. The increase in fleece weight alone was often not sufficient to cover the cost of the additional supplementary feed provided. Increasing the reproduction rate or stocking rate of the breeding ewes decreased their fleece weight, staple length and staple strength. However, there was again no net effect on wool price, with the decrease in fibre diameter countering the deterioration in the other fleece characteristics. The effect of the reduction in fleece weight on financial returns was small in comparison to the beneficial effects of the additional sheep shorn and sold. For the range of reproduction rates and stocking rates considered in this study, the increase in production per unit area easily outweighed the decline in production per animal. These analyses have highlighted the importance of the interactions between the fleece characteristics in their response to changes in management, as well as interactions between wool and other components of production. Future attempts to devise farm management strategies for improving wool quality should pay special attention to these interactions and to the relative effects of individual fleece characteristics on wool price.
|

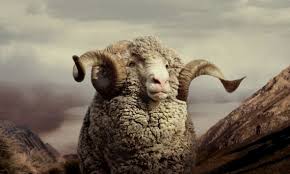
How can New Zealand producers increase the level of fine wool production?

History of merino

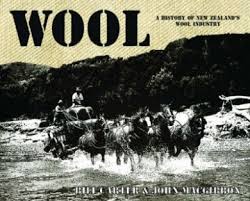
NZ Wool Industry

Managing Wool Staple Strength in Intensive
Merino Systems

The potential to improve wool quality and on-farm productivity
Market Focused Wool Production
| ||
Venison
|
DEEResearch - http://www.deeresearch.org.nz/ The New Zealand deer industry's major research website.
Cervena - http://www.cervena.com/ What is Cervena, how to buy it, and guide to cooking Cervena New Zealand Deer Farmers' Association - http://www.deernz.org Information on the role and structure of the NZDFA, both nationally and locally. | ||||
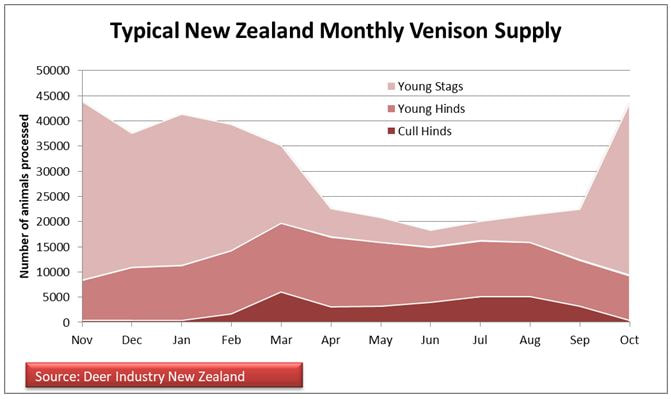
Typical Venison Production CycleNew Zealand venison marketing companies can deliver premium quality venison 12 months of the year. However, because a natural pasture based farming system is used in New Zealand there are peaks and troughs in the supply of chilled venison due to the annual production cycle. Supply is highest through the New Zealand Summer and fall - October to March, and lowest in the New Zealand winter months April through to August. Farmers can grow young deer quickly on fresh spring and summer pastures but will need to use stored feed during the winter, so most farmers will aim to grow their young deer to the desired weights before the onset of winter.
Nearly all deer bred for venison production in New Zealand are processed before the animals are two years of age. New Zealand processing facilities operate year round, venison marketing companies will agree delivery times with their suppliers to ensure a constant supply of venison over the whole year.
This information provides a simplification of the New Zealand venison production cycle. The actual dates of these activities will vary between different farm systems and geographic location, but this is a guide to when most of these events happen on most New Zealand farms.

https://deernz.org/venison-market-prices-peak#.WzM_oNOFM_U Venison market prices peak?
Venison to any corner of the globe.New Zealand exports venison around the world 12 months of the year by refrigerated container. This is an extremely efficient means of transporting goods long distances. Shipping goods by seafreight uses only 10% the energy of shipping by trucks. Container ships emit only 1% of the CO2 of airfreight, per tonne per km travelled.
Venison to any corner of the globe.New Zealand exports venison around the world 12 months of the year by refrigerated container. This is an extremely efficient means of transporting goods long distances. Shipping goods by seafreight uses only 10% the energy of shipping by trucks. Container ships emit only 1% of the CO2 of airfreight, per tonne per km travelled.
Some Articles Concerning the Venison Markets
| 27_april_2017_venison_markets_diversify.docx |
| promising_prospects_for_venison_boosted_by_us_demand.docx |
| venison_approaches_record_prices_as_us_appetite_grows.docx |

The Key elements of Success and Failure in the Venison Industry.
|
| ||
Deer Milk
| internal_assessment_resource__milking_deer.docx |
|
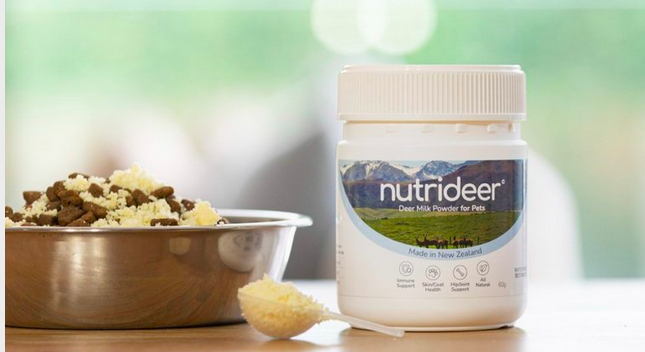
The cow is far from the only animal to be raised for its milk; goats and sheep are obvious ones, but yak, camel, donkey, and other mammals have always been dairy makers, too. New Zealand company PÄmu, previously and less enticingly known as Landcorp, is a state-owned agribusiness, and it’s bringing a new product to our pantries: deer milk.
The specific deer they’re milking is the red deer, a very large species native to western Europe and introduced to New Zealand in the late 19th century as a new, fun animal for hunters to hunt. It’s not the only member of the ruminant family to be milked, as reindeer milk was common in Scandinavia until the 20th century, and moose milk is still produced in Russia today. Though deer are common in much of the world, they’re typically not milked for a few reasons: for one thing, they don’t produce large quantities of the liquid, and for another, many countries, including the U.S., don’t consume much venison, and so the animals have never been domesticated in large numbers. Milk from these animals is quite different from cow milk; it’s much lower in sugar, and much higher in fat and protein. PÄmu is the first company to commercially raise red deer for milk, which they’re drying into a powder, to be reconstituted later. The company has an 80-head herd deer, each of which produces a couple hundred liters of milk per season. In contrast, a dairy cow is typically artificially inseminated to keep it producing milk year-round, and produces on average over 8,700 liters of milk in a year. Because of the low production rates of red deer, and because there’s only the one place milking them, prices are expected to be quite high. 


|

|
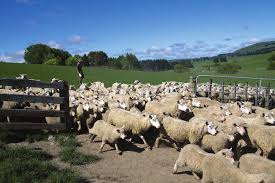
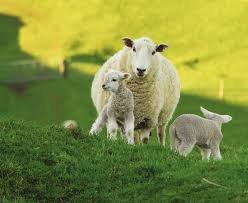
LAMB
|
| ||||
|
|
|
|
|
|
What does the future look like for New Zealand lamb?
https://www.nzipim.co.nz/BlogPost?Action=View&BlogPost_id=7 |

|
| optimising-sheep-systems-for-better-returns.pdf |
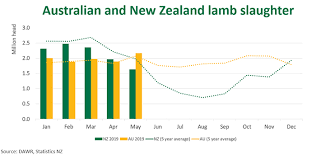
lamb statistics
|
| ||
Power points
|
|
| ||||||

Checklist for Research Project
|

Today's PPT
|